Weeknote 01
Over the last few months I've been introducing concepts and methods from service design into the design process at The National Archives. The day to day responsibilities of my role as a Senior Interaction Designer are often to zoom into the product detail, including user journey definition, accessibility related work, and implementing UI patterns and components to accommodate user needs. Since we're considering new features that open the door to a new set of users it is an opportunity to revisit the user research that goes outside the bounds of the product (e.g. usability testing) and consider the holistic journey in a mini-discovery of sorts. In the case of our service, this involves zooming out to look at the users' context when they are far away from touching our designed digital interfaces, and are in the early stages of prepare for transferring consignments of digital records to The National Archives.
We have a mini-workshop next week focussing on the backstage of the service. It's primarily information gathering and the rough outputs will form the beginnings of a map.
So, I've been continuing to read about and experiment with different mapping methods that are applicable in a service design context, e.g. experience maps, journey maps and service blueprints. They are familiar in the way that we all know how to read a diagram and, as design practitioners, have certainly made a few similar things in our own vision. Each mapping method has its own established history, often from another discipline such as HCI, business or marketing, and has a defined visual format and an approximate approach to its creation. Interestingly, there is even an British Standard for service design, which I'm yet to read because it's behind a paywall.
I'm interested in knowing how they are defined and what the histories are but also what a design practice brings to them. One of the seemingly obvious competencies offered by designers is visualising unstructured, mostly qualitative information collected throughout discovery or user research. Creating a more finessed version of the raw data, qualitative insights, and system sketches in a form that tells a narrative, or allows one to be explored.
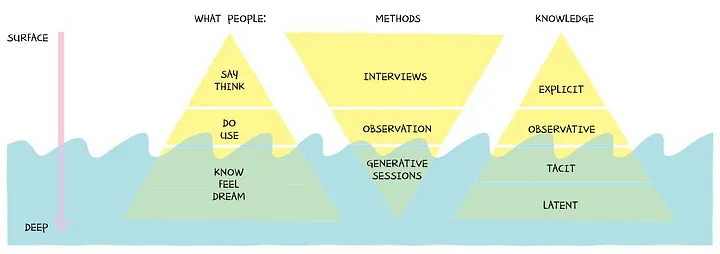
However, I think considering this as a visual design task alone would be a missing the point. The storytelling is as much about the content choices (what is included, left out, emphasised) as it is the decisions on colour, shape and composition. Also, often the process of co-creating the artefact can be the most resonant for everyone involved. Learning about the complexity of the system being mapped happens whilst people are creatively engaged in the task at hand. It's a generative research process. Therefore, it is equally important how we create, discover or generate that information as how it is eventually rendered in a graphical form.
 Image from Convivial Toolbox by Liz Sanders and Pieter Jan Stappers
As the next few months progress I'm going to be writing more about the softer skills of service design, for example, facilitation and co-design.
From my experience it is within the process of information gathering in a structured, collaborative way that we create collective understanding of complex systems and user needs. I'm interested in running more of these activities that could be called 'generative', and crucially writing about those here to help understand the value of them.
Reading:
- Convivial Toolbox: Generative Research for the Front End of Design by Liz Sanders and Pieter Jan Stappers.
- Has design become too dogmatic? - fastcompany.com
I'm interested in how the standardised formats have become the de-facto methods of visualising specific sorts of information. If you were to ask an information designer to take the raw content/information that is included in, for example, a Service Blueprint, would they always choose these similar, visual representations formats? Perhaps, because the information is always linear/chronological, they would.
…
In most cases, an output from a service design process, such as a service blueprint, is expected to be self-contained and self-explanatory, making it easy to be shareable, interpretable and/or convincing. There is value in this affordance, however, when these artefacts are co-created they will start in a messy state.
….